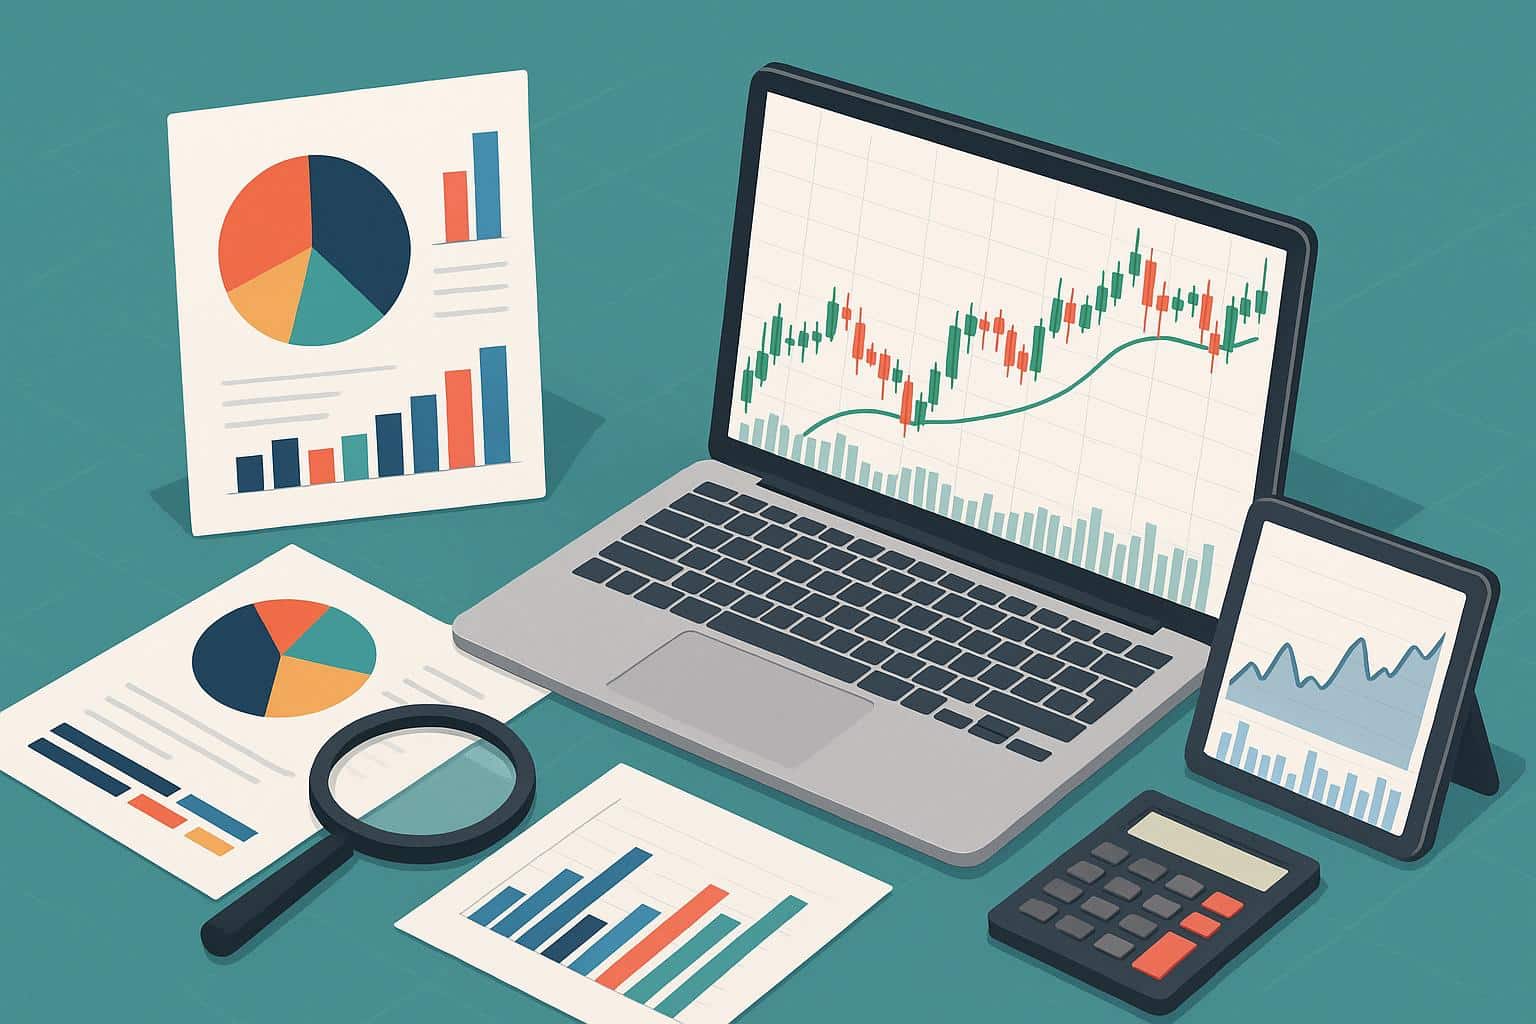
Tracking the markets day by day can feel like managing dozens of screens. There are real-time stock quotes, news headlines, quarterly reports, and charts constantly flowing in. We’ve seen how quickly things spiral into information overload; studies show that investors have a limited capacity to process information, and too much data often leads to worse decisions.
As a result, an overflowing inbox of alerts, a dozen browser tabs, and panic over something you might have missed.
- Why Daily Market Tracking Gets Messy Fast?
- 7 Stock Research Tools That Help Investors Track the Market More Efficiently
- 1. Screening Tools for Narrowing Down Opportunities
- 2. Earnings Calendar Tools for Event Tracking
- 3. Watchlist and Alert Tools for Price Movement Monitoring
- 4. Financial Statement Tools for Quick Company Checks
- 5. News Aggregation Tools for Faster Market Scanning
- 6. Analyst Estimates and Rating Trackers
- 7. Portfolio Tracking Tools for Daily Performance Review
- Final Take
The good news is that the right research tools can tame this chaos. In this post, we’ll share seven categories of tools we rely on: from screeners to portfolio trackers, and explain how each makes daily market tracking smoother.
Read on to learn what to look for so you can cut through the noise and spot key opportunities more easily.
Why Daily Market Tracking Gets Messy Fast?
Daily market tracking gets messy fast because there is just too much moving at once. Prices change, news breaks, sentiment shifts, and suddenly you are not tracking one thing anymore but trying to keep up with dozens of small changes happening across different stocks, sectors, and data points.
It also gets confusing because not every movement actually matters. Some changes are just noise, but when you are checking the market every day, everything can start to feel urgent.
That is usually when people end up with too many tabs and notes, and no clear system for what deserves attention and what does not.
After a while, the real problem is not a lack of information. It is that there is too much of it coming in too quickly to process cleanly and usefully.
How Smart Investors Choose Research Tools They Will Use
Not all research tools are created equal. Smart investors pick tools based on what works for them. Key criteria include ease of use, coverage of required data, and reliability.
However, a strong research tool should combine key information in one place. Quotes, charts, news, and financial metrics should be easy to access without having to switch between multiple websites.
Here are the main factors smart investors consider:
Customization: Investors should be able to create filters, build watchlists, and set targeted alerts. Personalization helps focus on stocks that match a specific strategy.
Reliability and speed: Market data must update quickly and accurately. Trusted platforms with stable systems are essential when prices move rapidly.
Cost: Many investors prefer tools with strong free versions or affordable plans. Transparent pricing and basic support are also valuable.
Practically, investors often test several tools before choosing one. If a platform improves efficiency and delivers accurate insights, it becomes part of the workflow. The best tools centralize key market signals rather than spreading them across multiple sources.
7 Stock Research Tools That Help Investors Track the Market More Efficiently
If you are an investor, the following stock research tools are made for you to help you track the market more efficiently:
1. Screening Tools for Narrowing Down Opportunities
Screeners (or stock screeners) are like search engines for stocks. You define criteria, say, “software companies with market cap over $10B and P/E under 30,” and the tool returns all matching tickers.
This is invaluable for narrowing focus. Without a screener, you’d have to eyeball financials one by one, which is impossible across thousands of symbols.
Screening tools quickly eliminate irrelevant stocks. Some popular screeners include SmartInvestorsDaily’s screening tool, Finviz, TradingView, Ziggma, Yahoo Finance, and our own SmartInvestorsDaily screener.
For example, you might screen for “small caps up 100% in the last year” or “top-rated dividend payers in healthcare.”
A key advantage of screeners is speed. They update in real time and display results instantly with sortable data such as yield or momentum. In short, screeners reduce thousands of stocks into a focused watchlist based on selected criteria.
2. Earnings Calendar Tools for Event Tracking
Earnings season often triggers sharp stock movements, and missing a report can mean missing an opportunity. Earnings calendar tools list upcoming company reports along with expected estimates, helping investors prepare for potential volatility.
Most major financial platforms, including SmartInvestorsDaily, Yahoo Finance, Nasdaq, and Investing.com, provide earnings calendars with filters for date, exchange, or sector. SmartInvestorsDaily also offers its own Earnings Calendar, which shows which companies report each week, along with expected EPS and report timing.
By using these tools, investors can set alerts and monitor key stocks on reporting days. This prevents surprises and allows better planning for strategies around earnings events.
3. Watchlist and Alert Tools for Price Movement Monitoring
A watchlist is a personalized list of stocks you monitor closely. Most brokerages, trading apps, and financial platforms allow investors to create watchlists to track stocks they own or plan to follow, all in one place. However, watchlists become far more useful when combined with alerts.
Investors often set alerts for specific events, such as a stock moving by more than 5% in a single day or experiencing a sudden increase in trading volume. Many platforms, including Fidelity, Robinhood, and Yahoo Finance, offer built-in price and news alerts that notify users when these conditions occur.
Alerts act like a monitoring assistant. They highlight important price moves or unusual activity that might otherwise go unnoticed. For example, if a stock suddenly jumps overnight, a push notification or email alert allows investors to review the news and respond quickly.
By combining watchlists with automated alerts, investors receive early signals about price changes or unusual trading activity. This helps them stay informed and react quickly without constantly watching the market.
4. Financial Statement Tools for Quick Company Checks
Before buying a stock, reviewing a company’s fundamentals, revenue, profits, debt, and cash flow is essential. Reading full filings like 10-K reports takes time, so we rely on tools that quickly display financial statements and key ratios.
Major finance platforms such as Yahoo Finance, MarketWatch, and Investing.com present income statements, balance sheets, and cash flow summaries in a clear format. These tables allow investors to quickly check key signals such as revenue growth, debt levels, and profit margins.
Advanced platforms like FactSet or Mergent offer deeper financial filtering, but free tools are often enough. While the SEC’s EDGAR database holds all official filings, it can be difficult to navigate. Many research platforms simplify this by pulling EDGAR data and presenting key metrics such as P/E, ROE, and debt-to-equity in one place.
These tools help investors compare companies quickly or verify financial claims. By turning complex financial data into simple metrics and charts, they enable faster, more informed decisions.
Related article: Index Funds vs Individual Stocks
5. News Aggregation Tools for Faster Market Scanning
News moves markets, but information is scattered across sources like CNBC, Bloomberg, company press releases, financial blogs, and social media. News aggregation tools bring these updates into one place, making it easier to track important developments.
Major platforms such as Yahoo Finance, Google News, and MarketWatch offer customizable news feeds. Investors can follow specific stocks or topics and view related headlines on a single dashboard. Yahoo Finance, for example, combines market data with articles, interviews, and analysis. Twitter can also act as a real-time news stream when following analysts and market commentators.
Dedicated apps provide even more focused updates. Platforms like Seeking Alpha collect analyst insights and community analysis, while MarketBeat and Benzinga deliver breaking news alerts. Feed tools such as Feedly or SmartNews allow users to subscribe to topics like earnings or sector updates.
The key advantage is speed. Instead of searching multiple websites, investors can scan one dashboard for relevant headlines. When major updates appear, such as earnings releases, policy announcements, or merger rumors, these tools surface them quickly.
In short, news aggregators reduce the time spent searching for information and help investors stay up to date on daily market developments.
6. Analyst Estimates and Rating Trackers
Analysts’ forecasts and ratings can trigger big moves too. If a well-known analyst raises a target or changes a rating, stocks often react.
Many platforms include consensus data. For example, Yahoo and Google Finance list next quarter’s earnings estimate and average analyst targets. There are also specialized trackers: TipRanks, Zacks, and I/B/E/S provide consensus changes and show how many analysts are bullish or bearish. SmartInvestorsDaily has an Analyst Ratings section that shows recent upgrades/downgrades.
These trackers act as a check on sentiment. If several analysts upgrade a stock this week, it suggests institutional interest and might justify closer attention. Likewise, if estimates keep rising, it can be a positive signal. We don’t blindly follow analysts’ words, but rating tools help spot when professional consensus shifts. In practice, whenever we see a surprise rating change on our watchlist, we’ll read the analysts’ notes to see if their reasoning highlights new catalysts or risks. It’s another layer of daily market scanning.
7. Portfolio Tracking Tools for Daily Performance Review
Portfolio trackers help investors monitor the overall performance of their holdings. Instead of manually calculating gains and losses, these tools automatically update positions and portfolio values, allowing us to focus on strategy rather than spreadsheets.
Platforms like Sharesight track trades, dividends, and overall performance while generating reports and insights. Many brokerage platforms, such as Fidelity’s portfolio dashboard, also provide similar tracking features. Investors can also use tools like Google Sheets with financial functions to monitor holdings.
Strong portfolio trackers show asset allocation, compare performance against benchmarks, and chart portfolio growth over time. By reviewing these dashboards regularly, investors can quickly identify positions that are overperforming, underperforming, or becoming too large in the portfolio.
Final Take
Daily market tracking does not have to feel chaotic. With the right tools, it becomes structured and efficient. We reviewed seven key categories, from screeners and earnings calendars to watchlists and portfolio trackers, because no single tool covers everything.
The goal is to build a balanced toolkit that fits your investing style. Some investors rely more on charts and screens, while others prioritize news feeds or financial data, but successful investors use these tools consistently.
For the investors, the approach is simple: let tools handle routine tasks while we focus on strategy.
We, as investors, may discover ideas through a screener, track earnings on a calendar, set alerts on watchlists, review fundamentals, monitor analyst sentiment, and follow portfolio performance. Using several tools together keeps us informed without information overload.