What the new crash data shows
Fresh crash reports filed with the National Highway Traffic Safety Administration (NHTSA) indicate how many crashes, per mile, the robotaxis are reporting. The agency maintains an Autonomous Driving System (ADS) incident database that tracks reportable events alongside miles driven.
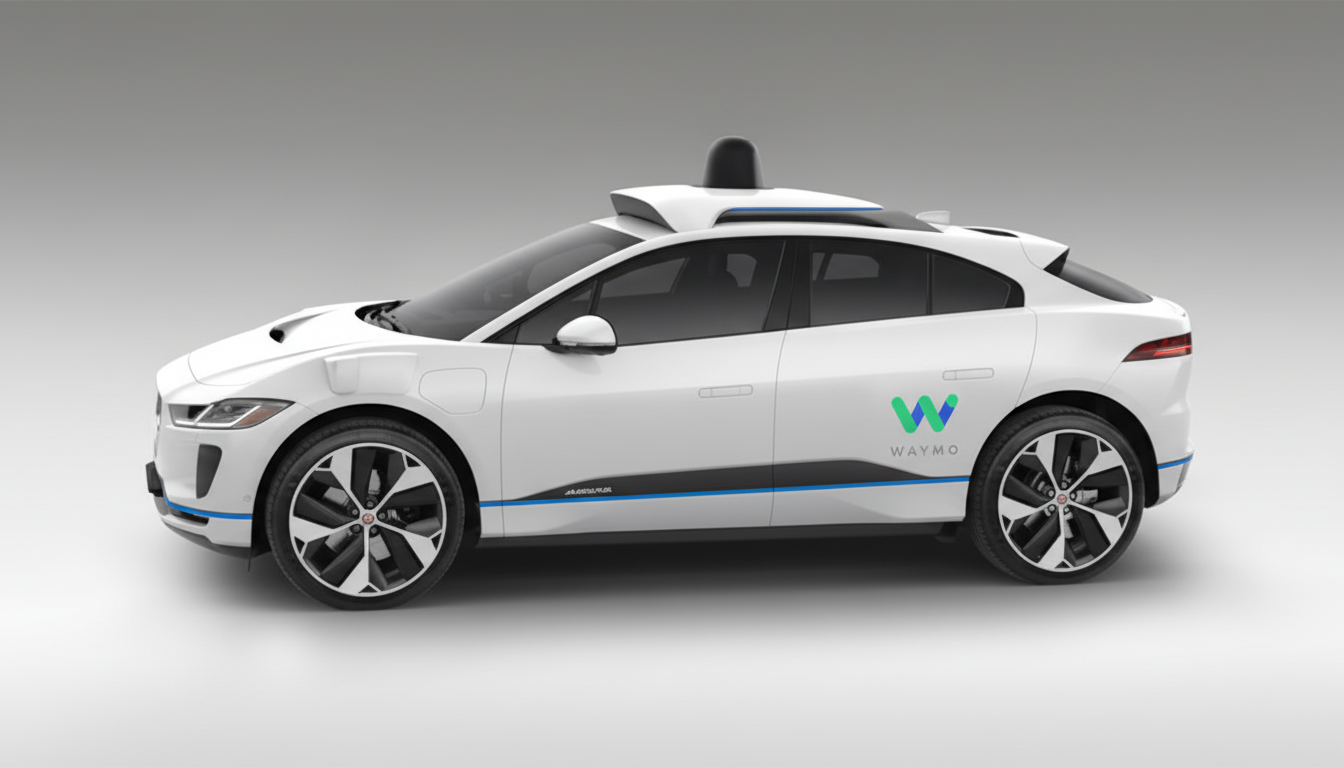
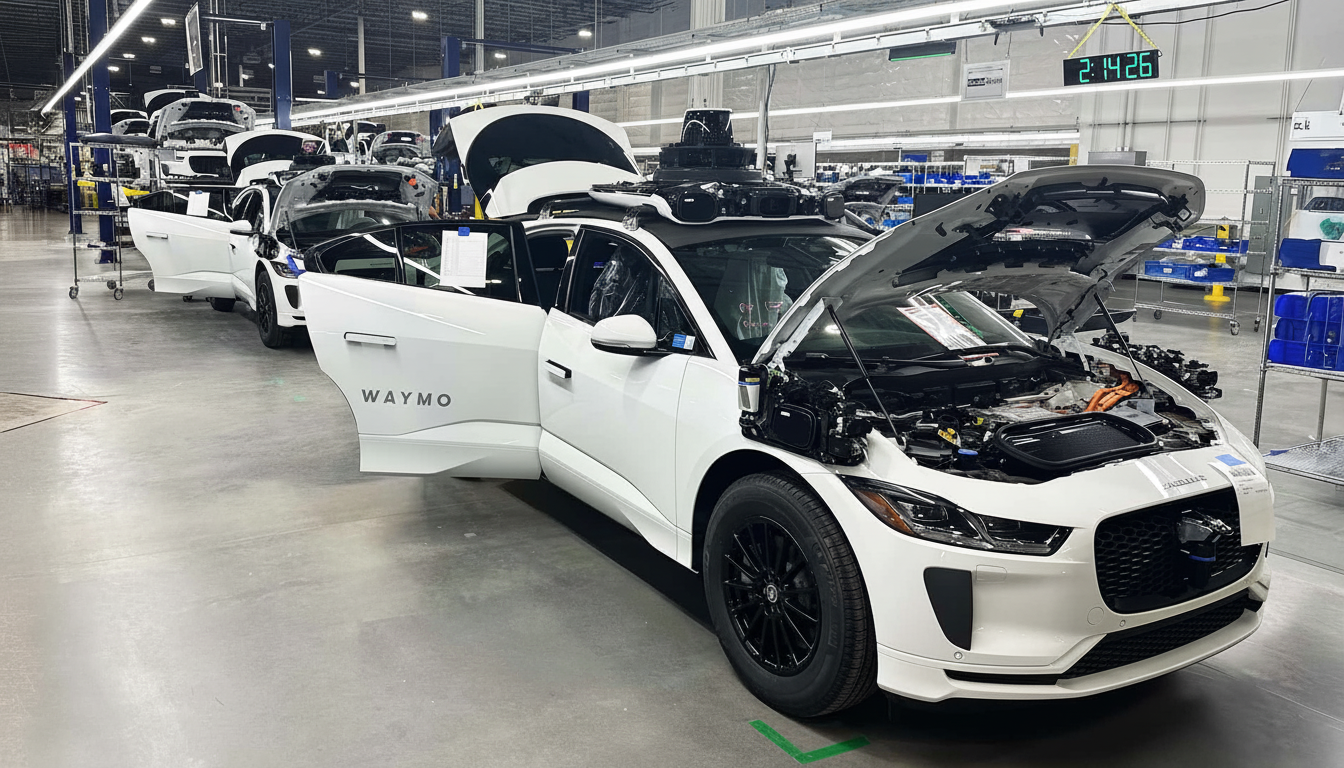
The flagship fleet of Tesla’s robotaxi program, located in Austin, has driven about 250,000 miles and reported four crashes. That equates to one crash every 62,500 miles, or about 16 crashes per million miles. Waymo says its driverless fleet has logged about 125 million miles and has 1,267 ADS crash records in the same federal database, which works out to one crash every 98,600 miles, or about 10 crashes per million miles. On those figures, Tesla’s rate is about 58% higher than Waymo’s.

- Tesla: 4 crashes over ~250,000 miles ≈ 16 per million miles
- Waymo: 1,267 crashes over ~125,000,000 miles ≈ 10 per million miles
- Approximate difference: Tesla’s rate is ~58% higher
How NHTSA receives and categorizes ADS crash reports
NHTSA’s Standing General Order for ADS crash reporting requires companies to notify the agency within five days of any ADS‑equipped vehicle associated with an incident when the system was in use or within 30 seconds of that use. Companies must include everything from low‑speed parking scrapes to high‑speed collisions under this 30‑second criterion.
Among the recent filings highlighted by an EV industry researcher, one of Tesla’s most recent reportable events involved hitting a fixed object in a parking lot. In contrast, Waymo’s disclosures frequently involve interactions with other road users, often when another driver is clearly at fault. The federal reports don’t assign fault, and the results cover everything from property damage only to crashes with injuries.
Importantly, state regulations vary. Texas requires Tesla to use a human safety monitor in its robotaxis, with a physical takeover switch. Waymo does not use in‑car safety drivers in its designated service zones; however, it continues to utilize remote interventions and geofencing. Despite this operational difference, Waymo’s composite incident rate remains lower.
Tesla’s crash rate is based on a small and early set of data. A single additional event would considerably alter the per‑mile calculation with only four reportable crashes. As routes, maps, and policies change, early pilots often encounter edge cases. Tesla’s federal disclosures contain extensive redactions, making it difficult for outsiders to assess severity, environmental conditions, or whether a human monitor needed to intervene. Waymo’s disclosures, while not exhaustive, have traditionally included more narrative detail and have been backed by state‑level reports.

One reason Waymo’s rate trends lower is due to scale and operational design. As of May, Waymo has logged over 125 million miles, aided by years of phased expansion in geofenced areas like Phoenix and San Francisco. Reach, speeds, and behaviors are limited to scenarios where the system has been validated. Pilots have generally seen fewer occurrences per mile.
What to watch as autonomous fleets scale up rapidly
Tesla’s rate will change as mileage accumulates and maps, routing, and driver‑monitoring policies are refined. Greater transparency—less redaction of ADS reports, consistent detail on severity, and clearer at‑fault coding—would improve comparisons between providers.
As fleets grow, so will the rules. NHTSA’s ADS reporting system has already created a standard language for crashes, and state institutions will follow suit. The frequency of crashes is only one factor analysts will watch, alongside injury rates, vulnerable road user involvement, and incidents classified as minor property damage.
Tesla’s early robotaxi program reports more crashes per mile than Waymo’s longstanding driverless fleet. Although this gap may shrink with more driving, for now—and until Tesla expands its reporting and adds more miles—we have better information than ever before.

