As the latest winter storm sweeps across multiple regions, the most pressing question is simple: how many inches have actually fallen where you live? You do not need to wait for TV recaps or step outside with a ruler. Official snowfall totals and high-resolution maps are already available from trusted agencies, updated as reports flow in.
Below is a quick guide to the authoritative sources, the fastest interactive tools, and how to interpret the numbers so you can confirm the exact inches on the ground in your neighborhood.
Where to See Verified Snowfall Totals Near You
National Weather Service local offices publish measured totals through Public Information Statements and Local Storm Reports. These lists are compiled from trained spotters, cooperative observers, emergency managers, and law enforcement, and they’re the gold standard for ground-truth inches by town and county. If you want the number that broadcasters cite, this is usually it.
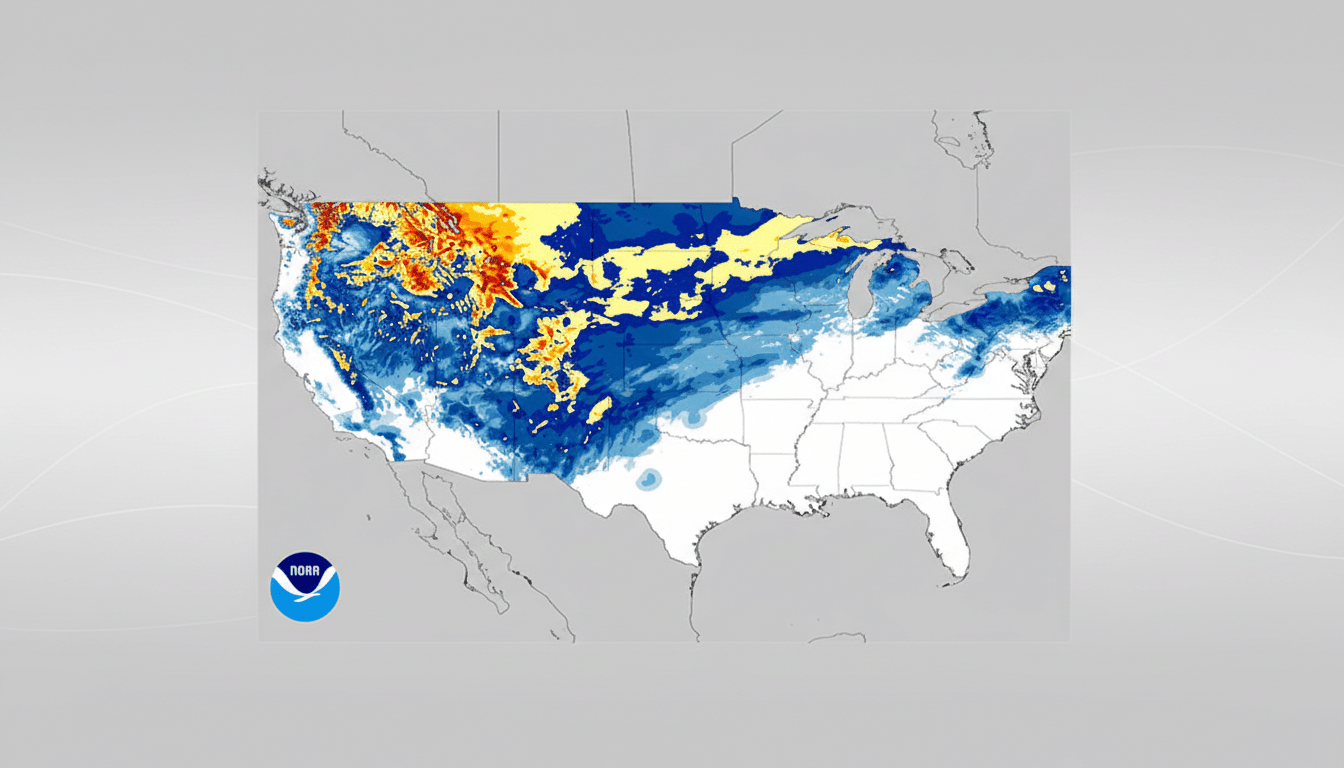
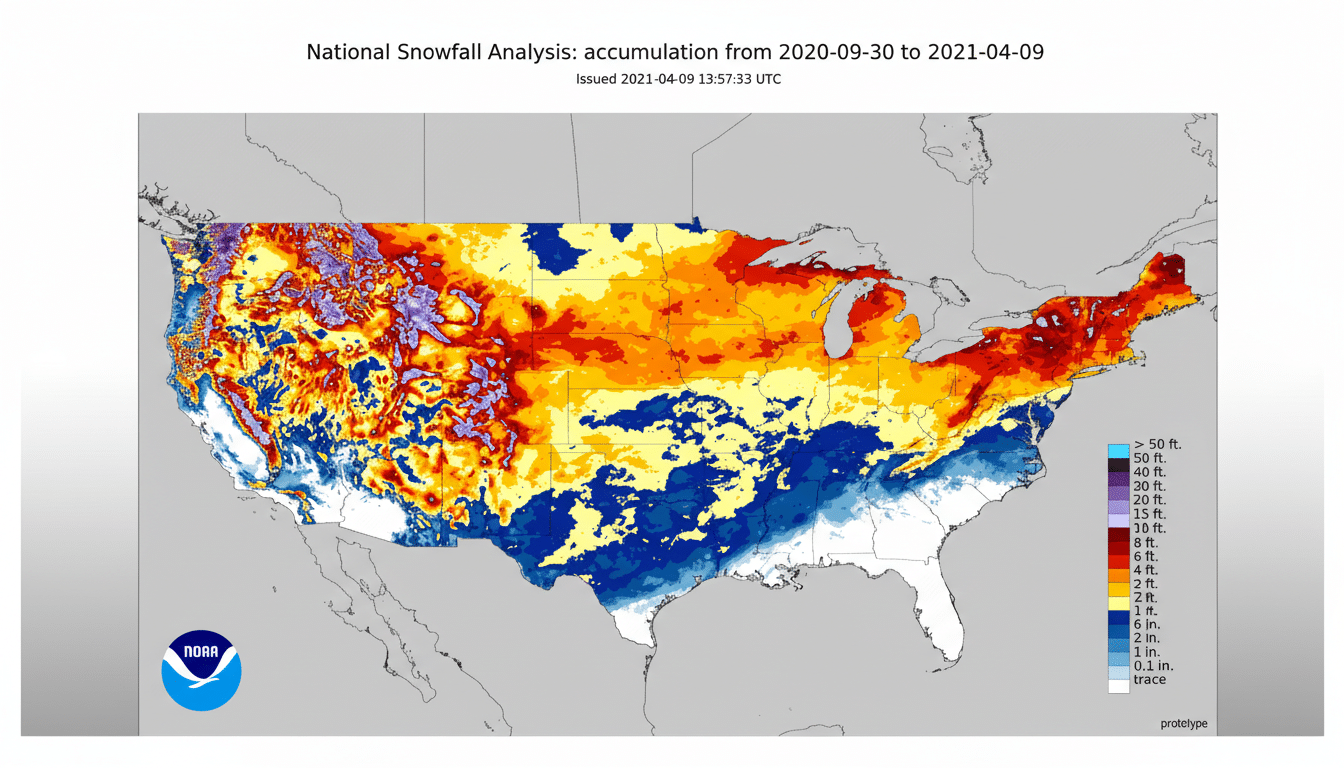
NOAA’s Snowfall Analysis maps visualize how much snow has fallen over the last 24 to 72 hours. These maps blend radar, models, and observed reports to fill in gaps, then display a color-shaded view of inches across the U.S. Think of this as your quick look for storm-wide patterns with local detail as you zoom.
The National Operational Hydrologic Remote Sensing Center (NOHRSC) runs the National Snow Analysis, which adds snow depth and snow water equivalent to the picture. Depth is what’s on the ground now, not just what fell, and it can differ from storm totals due to melting and compaction.
For finalized, quality-controlled numbers, the National Centers for Environmental Information publishes Daily U.S. Snowfall and Snow Depth from the Global Historical Climatology Network. These summaries lag real time but are the archival record used by researchers and utilities.
You can also cross-check community observations through the CoCoRaHS volunteer network. While not every neighborhood has a trained observer, this network often provides block-by-block granularity that complements official reports.
Best Interactive Maps for At-a-Glance Inches
Newsroom-built snowfall dashboards aggregate the same National Weather Service data into streamlined, mobile-friendly maps. Many let you toggle between the last 24, 48, and 72 hours, and some add a season-to-date view so you can see how the current storm stacks up.
Forecast-first platforms like Windy offer a “snow accumulation” layer that projects how many inches may fall next; combine that with an observed snowfall layer or local storm reports to separate what has already fallen from what’s expected. Use forecasts for planning, but defer to observed totals for confirmation.
Several state climatology offices and university mesonets (for example, the New York State Mesonet and the Iowa Environmental Mesonet) maintain live dashboards with station-by-station totals. These are excellent for spotting micro-scale variations within metro areas.
Make Sense of Snowfall Versus Snow Depth at Home
Snowfall is the new accumulation from the storm. Snow depth is the total snow currently on the ground. They rarely match. If the snow is wet and heavy, it compacts quickly, so 8 inches of snowfall might register as 5 or 6 inches of depth by morning. Conversely, powdery snow can drift, piling up on one side of a street while scouring the other.
Snow ratios matter, too. The rule of thumb is 10:1 (ten inches of snow per inch of liquid), but storms commonly range from about 5:1 in warmer setups to 15–20:1 in very cold, fluffy events. That means two towns that got the same liquid precipitation can report very different snowfall totals.
Why Your Snowfall Number Can Differ from Others
Wind undercatch reduces what gauges and boards record, especially on exposed hills. Drifting creates hyperlocal extremes that official maps smooth out. Urban heat islands can trim totals near dense cores while suburbs pile up more. Timing matters as well; early snow on warm pavement melts before later bands stick.
Measurement technique is critical. The National Weather Service standard is to measure on a level “snowboard” (a white board on the ground), away from drifts, every 6 hours, then clear the board. Reports taken from decks, cars, or lawns can bias readings high or low. When comparing numbers, prioritize NWS quality-controlled observations.
Quick Steps to Confirm Inches at Your Address
- Open your local National Weather Service office page and look for Public Information Statements or Local Storm Reports listing snowfall by town.
- Cross-check with NOAA’s Snowfall Analysis map for the last 24–72 hours to visualize surrounding gradients and banding.
- Consult NOHRSC’s snow depth if you want to know what’s currently on the ground, not just what fell.
- Validate with nearby CoCoRaHS observations for neighborhood-scale context, then revisit NCEI’s daily summaries later for the final archived totals.
With these tools, you can verify the storm’s footprint down to your block and know precisely how many inches fell—no guesswork, no yardstick required.