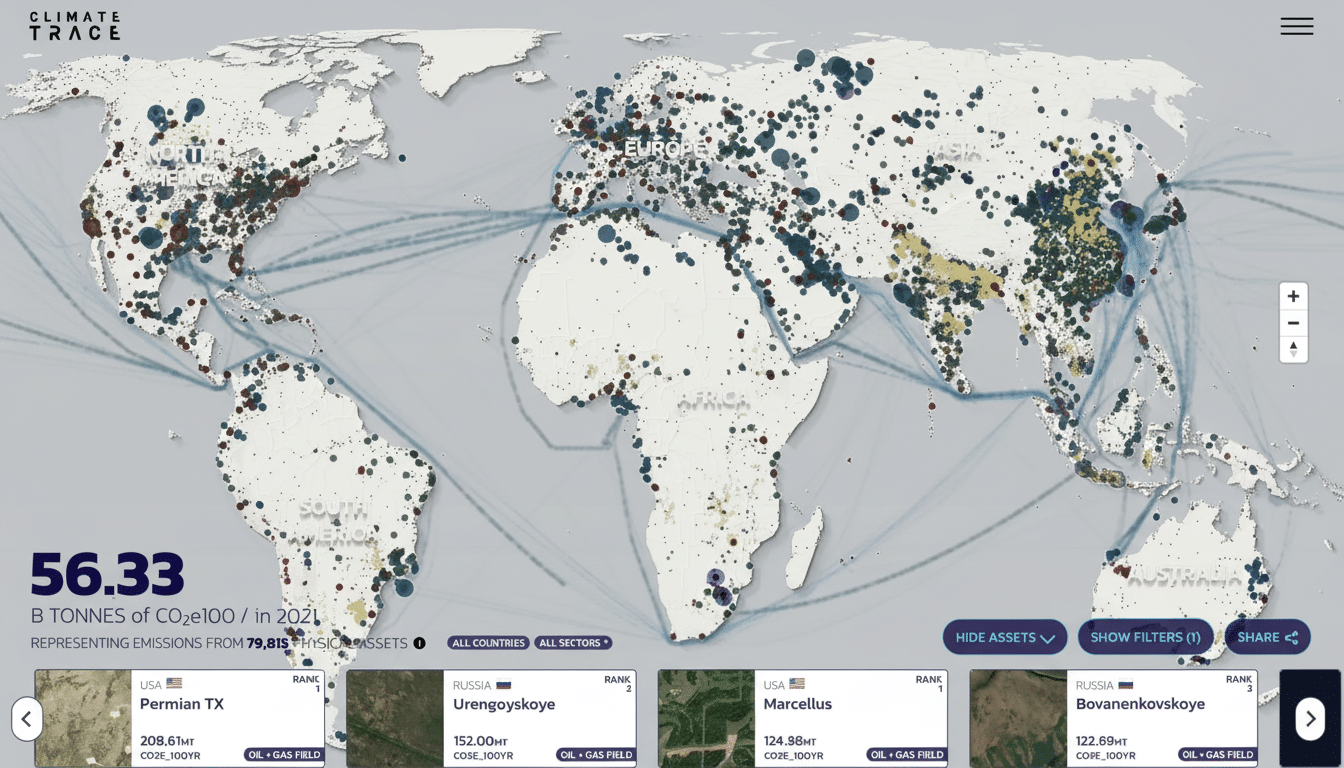
Al Gore, the former vice president of the United States, co-founded a nonprofit coalition called Climate TRACE, which has built an artificial intelligence system to track man-made fine particulate pollution from more than 660 million sources worldwide, transforming a sprawling and diffuse health threat into something particular, included on a facility-level map.
The new tool broadens Climate TRACE’s mission from greenhouse gases to deadly particles called PM2.5—particle pollution so fine that the particles are actually minuscule specks that become embedded deep in the lungs and enter the bloodstream. Health researchers estimate that PM2.5 exposure leads to millions of early deaths per year, according to recent estimates from the World Health Organization and the Global Burden of Disease project that are in the 4 million–9 million range worldwide.

How the AI system uncovers hidden pollution
Climate TRACE combines images from satellites, industrial registries, and shipping transponder data with ground-based measurements to track pollution in near real time. Smoke plumes, flare signatures, and stack emissions get picked up by computer vision models; geospatial algorithms then match those with specific facilities—like refineries, power plants, cement kilns, steel mills, and ports.
In the dispersion modeling, plumes were simulated to see how they spread and become diluted with time in different wind, temperature, and humidity conditions by team members from Carnegie Mellon University. The system then computes potential exposure footprints close to population centers, providing both raw source data and visualizations telling where particulate matter is likely to travel.
To enhance the precision of its results, the platform cross-references outputs with trusted data such as national emissions inventories and networks of air quality monitors run by organizations such as the U.S. Environmental Protection Agency and the European Environment Agency, including community sensor aggregators.
The result is a global, facility-linked view that had been impossible to build without AI.
From emissions to exposure: mapping health impacts
Gore’s effort to track particulates emerged from environmental justice work in Memphis, where locals opposed to a crude oil pipeline near their drinking-water aquifer created the MANTID (Memphis and North Mississippi Tagging Information Database) initiative. The mapping of local refinery plumes made it feel real. The same principle now applies at a global scale: By showing where particles come from and where they go, officials and communities can focus interventions that save lives.
PM2.5 is connected not only to lung disease and heart attacks, but also to adverse pregnancy outcomes and life-shortening chronic conditions like diabetes and dementia, according to research by teams across Harvard, the Health Effects Institute, and global collaborators. Joel Schwartz, a prominent epidemiologist at the Harvard T.H. Chan School of Public Health, was among those who helped establish early evidence that even small increases in fine particles elevate mortality well below legal thresholds.

The tool can help expose dramatic patterns: coal units that elevate the risk downwind from towns, refinery complexes that extend their plumes over residents living nearby, industrial corridors where cement, steel, and petrochemicals are concurrent, and shipping lanes or ferry routes that draw diesel soot into port communities. By identifying facilities locally, local leaders can pinpoint the dirtiest actors.
Why this is important for climate and policy
Cutting PM2.5 from burning fossil fuels yields fast health gains and climate co-benefits. Black carbon, one of the components of soot, is a potent short-lived climate pollutant whose reduction could slow near-term warming and limit melting in snow and ice regions, according to research from several organizations including the Intergovernmental Panel on Climate Change and the Arctic Council.
Transparency is leverage. Regulators can wield the dataset to enforce standards; investors and insurers can weigh risk; companies can compare facilities and justify upgrades; advocates can bring granular, Google-worthy evidence to air permit hearings. By linking emissions to names and locations, the system reorders incentives for cleaner fuels, electric industrial heat, and end-of-pipe controls like scrubbers and filters.
Verification, caveats and continuous improvement
Attributing particles precisely is hard. Wildfires, agricultural burning, and dust storms confound the signal, and some areas do not have dense networks of monitoring sites. In order to address this, Climate TRACE flags confidence ranges, disaggregates natural and anthropogenic sources when feasible, and trains models iteratively as new satellite constellations get launched and low-cost sensors revolutionize coverage.
Independent validation matters. Cross-calibration with ground stations, mobile monitoring campaigns, and academic groups’ peer-reviewed methods serve to minimize bias and eliminate false positives. The coalition has said that it will release methods and the histories of versions so policymakers and scientists can examine assumptions and replicate results.
What comes next for the platform and its rollout
Climate TRACE plans to release global plume visualizations and city-level dashboards that will rank hotspots, identify “super-emitters,” and track potential health benefits of particular interventions. Connectivity with permitting processes, procurement policies, and corporate disclosures could speed adoption.
The promise is tangible for communities: a map that leads to the stack, flare, or ship targeted for action. It’s a blueprint for fast, measurable reduction in risk for governments and industry. And for climate policy, it is a reminder that one of the fastest ways to save lives and cool the planet often starts with going after the same targets—tackling the dirtiest sources first.

