T-Mobile has taken the top spot in the latest nationwide speed testing, outperforming Verizon and AT&T in a broad measure of mobile performance compiled by Ookla, the company behind the Speedtest app. The user-sourced study points to stronger everyday speeds and 5G availability on T-Mobile, even as Verizon holds a notable lead in overall coverage.
How Ookla Measured It: Inside the Connectivity Score
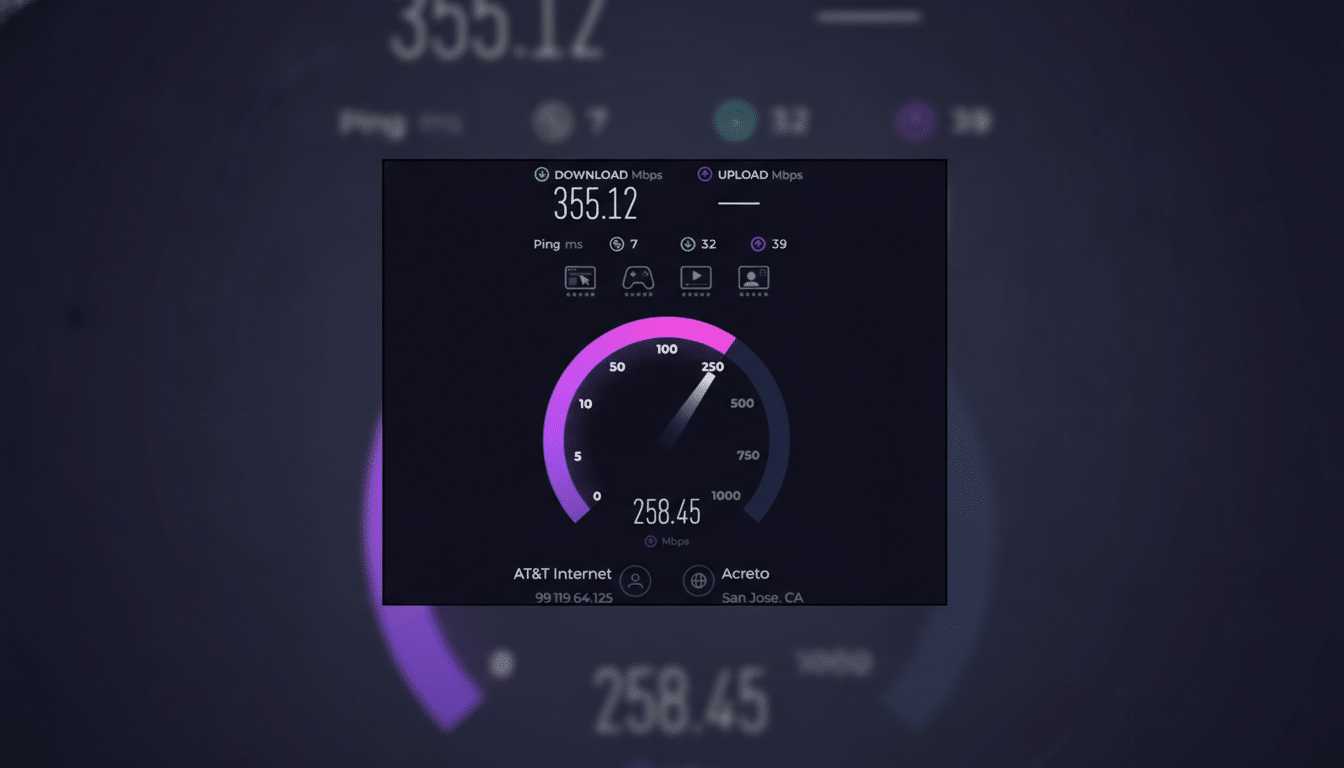
Ookla’s Speedtest Connectivity Report aggregates millions of tests initiated by consumers and weighs more than raw throughput. Its composite Connectivity Score blends median download rates with signal quality indicators tied to web browsing and video-streaming responsiveness. Think of it as a snapshot of how phones actually feel in the hand, not just what a lab meter can peak at.
- How Ookla Measured It: Inside the Connectivity Score
- The Leaderboard in Numbers: Speeds, 5G, and Coverage
- What It Means for Everyday Use on Your Carrier
- Why Another Report Puts Verizon First in Reliability
- Fixed Broadband Snapshot: Fiber and Wireless Trends
- Bottom Line: Match National Results to Local Reality
That approach differs from the controlled, side-by-side drive and walk tests run by RootMetrics, a separate research unit under the same corporate umbrella. RootMetrics’ methodology tends to elevate consistency, reliability, and call performance across identical routes, while Ookla’s readings capture the messiness of real-world usage across countless locations and devices. Both lenses are useful, but they can yield different winners.
The Leaderboard in Numbers: Speeds, 5G, and Coverage
In the composite ranking, T-Mobile posted a Connectivity Score of 81.52, ahead of Verizon at 76.57 and AT&T at 74.5. T-Mobile also recorded the top median download speed at 259.48Mbps and the fastest median 5G download at 309.41Mbps. Those are not peak lab speeds; they reflect what users commonly see when they tap “Go” in the Speedtest app.
T-Mobile’s edge extends to 5G availability—the share of time users are actually on 5G—at 91.2%. AT&T follows at 87.5%, with Verizon at 59.9%. But coverage tells a different story. Ookla’s analysis shows Verizon in front on geographic reach with 30%, versus 25.2% for AT&T and 23.9% for T-Mobile. Availability and coverage aren’t the same: one reflects time spent on 5G where you are; the other reflects how much of the map a carrier touches.
The split tracks with network strategy. T-Mobile has leaned heavily on mid-band 2.5GHz spectrum to blanket more people with fast 5G, producing high real-world speeds where its “Ultra Capacity” service is present. Verizon’s build has emphasized broader reach, including extensive C-band and low-band layers that shore up rural and exurban service. The practical takeaway: speed leadership can concentrate where people live, while coverage leadership often stretches where fewer do.
What It Means for Everyday Use on Your Carrier
At these medians, all three carriers are comfortably beyond the 25–50Mbps many services recommend for 4K streaming and well past the 100Mbps many households consider “fast” for home broadband. High-resolution video calls, large app downloads, and cloud gaming sessions feel snappier on networks with higher median throughput and lower latency, and that’s where T-Mobile’s advantage shows up in daily use—particularly in mid-band 5G zones.
Performance still varies block by block. Congestion at stadiums, high-rise building materials, and indoor coverage quirks can flatten any single-number ranking. If you rely on hotspot tethering or upload-heavy workflows, experiences can diverge further, since uplink capacity and traffic management policies differ across carriers and plans.
Why Another Report Puts Verizon First in Reliability
RootMetrics’ most recent nationwide testing crowned Verizon the overall network leader by slim margins, reflecting a methodology that prioritizes controlled reliability and balanced performance across identical routes. Ookla’s crowd-based data, by contrast, surfaces what people encounter in the wild, including time-of-day congestion and device mix. Carriers often use both datasets in tandem: one to benchmark engineering progress, the other to track how it translates into lived experience.
Fixed Broadband Snapshot: Fiber and Wireless Trends
Ookla’s residential rankings put AT&T Fiber on top with a Connectivity Score of 84.9, ahead of Verizon at 82.57, Cox at 80.52, Comcast’s Xfinity at 80.17, and Charter’s Spectrum at 78.92. AT&T Fiber also posted the fastest median download at 369.39Mbps.
There’s an important nuance: Ookla reports AT&T’s fiber performance separately from its other access technologies, while it aggregates competitors’ fiber and fixed wireless access in a single score. That means Verizon’s number blends Fios fiber with 5G fixed wireless, which can pull down the aggregate. Ookla has urged more providers to adopt this kind of segmentation so consumers can compare fiber-to-fiber and wireless-to-wireless apples to apples. The broader trend remains clear: 5G fixed wireless has given millions a viable alternative to cable in markets with limited fiber choice.
Bottom Line: Match National Results to Local Reality
The latest speed tests reinforce T-Mobile’s momentum in real-world performance, while Verizon maintains a coverage edge and strong showings in controlled reliability testing. AT&T remains competitive across both mobile and fiber. For buyers, the smart move is to pair national rankings with hyperlocal checks—because the best network is the one that is fastest and most consistent where you actually use it.