If your Linux PC is dragging its feet on startup, the fastest way to find out why is sitting right on your system. The systemd-analyze utility, included with any distribution that uses systemd, can surface the exact culprits in seconds and help you cut boot times without guesswork.
Rather than randomly disabling services, this tool lets you see where time is spent across firmware, kernel, and userspace, then act with surgical precision. Here’s how seasoned admins use it to turn a sluggish boot into a quick hop to the login screen.
- What the systemd-analyze tool does during boot analysis
- Run a quick system-wide boot health check in seconds
- Find the slowest boot services with a single command
- Trace boot bottlenecks using the critical-chain view
- Get a visual boot timeline with systemd-analyze plot
- Make targeted boot-time fixes safely and reversibly
- Real-World Gains And Where To Learn More
What the systemd-analyze tool does during boot analysis
systemd-analyze inspects the init sequence orchestrated by systemd and reports how long each stage and service took to initialize. On modern releases, it breaks the total into firmware, bootloader, kernel, and userspace. That separation matters: if most time is logged under firmware or loader, tweaking Linux services will not help, and you should look at UEFI settings or disk controller initialization instead.
Run a quick system-wide boot health check in seconds
Open a terminal and run systemd-analyze. In a single line, you’ll get total boot time and a split of where it went. If you prefer a more compact summary, try systemd-analyze time. On typical SSD-based desktops, you’ll often see kernel well under 5 seconds and userspace doing the heavy lifting; on spinning disks, userspace initialization commonly dominates.
Pro tip: if your total includes a conspicuously large firmware or loader segment, disable slow boot logos, network boot entries, or unused storage controllers in UEFI. That can shave multiple seconds before Linux even starts.
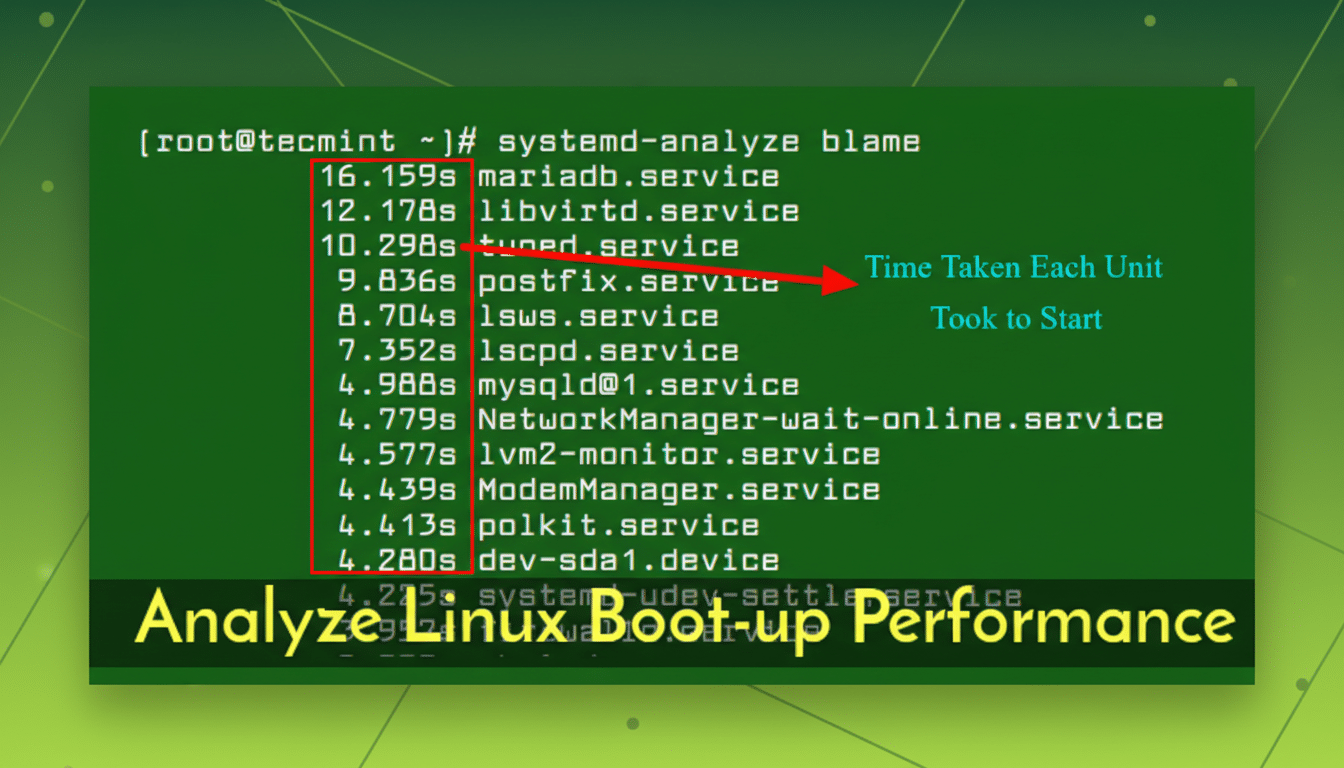
Find the slowest boot services with a single command
To rank services by how long they delayed the last boot, run systemd-analyze blame. You’ll get a top-to-bottom list of units and durations. On many desktops, usual suspects include snapd and snapd.seeded, apt-daily and apt-daily-upgrade timers on Debian/Ubuntu derivatives, NetworkManager-wait-online or systemd-networkd-wait-online, container runtimes such as docker and containerd, cloud-init on images repurposed for bare metal, and periodic jobs like fstrim or man-db.
Not everything at the top should be disabled: auto-update timers and disk maintenance are there for good reasons. But you can reschedule or adjust them. For instance, moving update checks to a time when the machine is usually on, or disabling “wait-online” if no service needs guaranteed network before login, can reduce perceived boot time without sacrificing reliability.
Trace boot bottlenecks using the critical-chain view
The command systemd-analyze critical-chain reveals the dependency path that held up reaching the default target. You’ll see when each unit started (after @) and how long it ran (+duration), forming a clear narrative: e.g., graphical.target waited on multi-user.target, which waited on docker.service, which in turn waited on containerd.service. If a unit you don’t need is on that path, disabling or deferring it can have an outsized impact.
This view is especially helpful when a single “wait-online” or a misconfigured mount holds the entire chain hostage with 30–90 second timeouts. If you see long waits on device units (dev-…device) or mounts, check fstab options and hardware health.
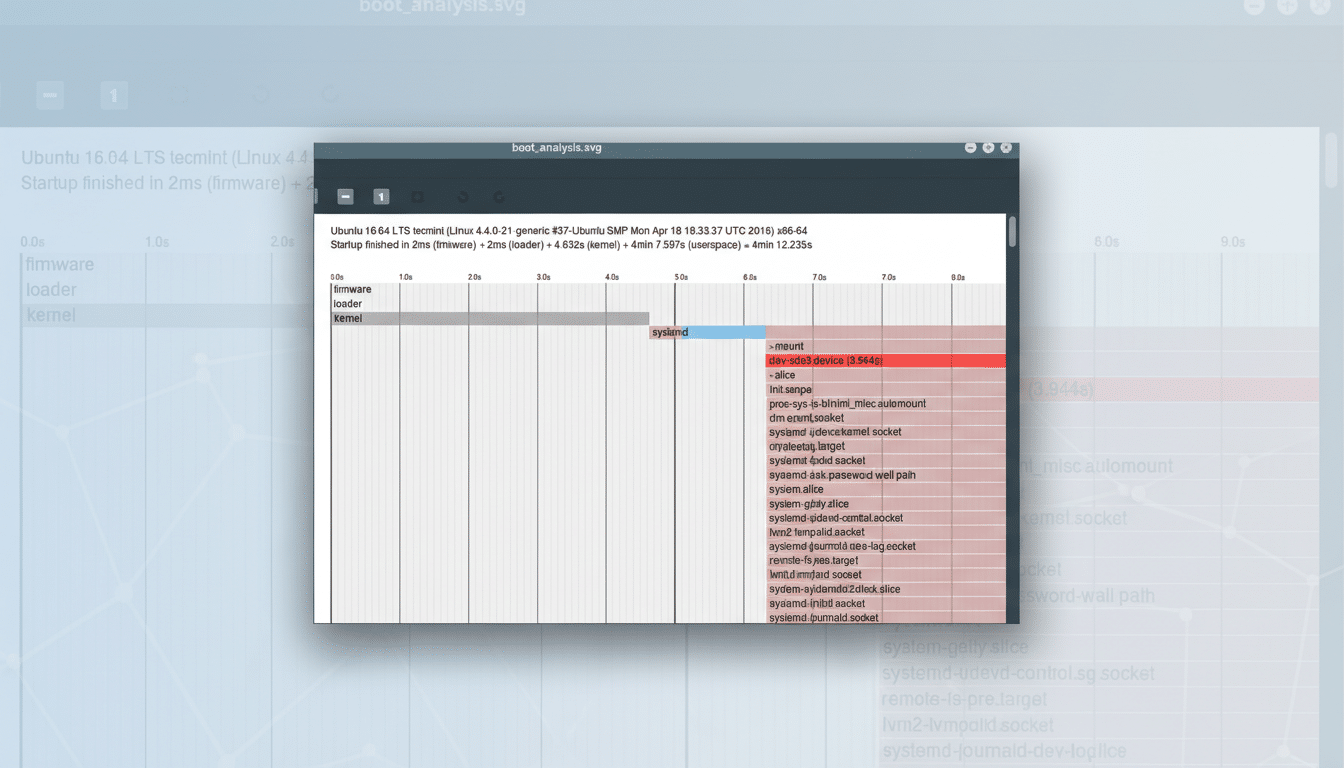
Get a visual boot timeline with systemd-analyze plot
Prefer pictures to lists? Generate a boot timeline with systemd-analyze plot > boot.svg and open it in a browser. The graphic shows parallelization, serial waits, and units that start late or run long. Large colored bars that block others are your prime candidates for tuning. On complex developer workstations, this often highlights container stacks and virtualization helpers kicking in before they’re truly needed.
Make targeted boot-time fixes safely and reversibly
Once you’ve identified the heaviest hitters, apply measured changes:
- Defer nonessential services: disable docker.service at boot if you don’t need containers immediately; start it on demand. For NetworkManager-wait-online or systemd-networkd-wait-online, disable only if no service depends on network-online.target.
- Tune timers rather than kill them: apt-daily and related timers can be rescheduled to avoid running on every boot. Disk trim jobs can run weekly during idle hours.
- Remove mismatched packages: cloud-init installed on a non-cloud laptop routinely adds seconds. If you don’t need it, uninstall it cleanly.
- Fix slow mounts: add noauto,x-systemd.automount to rarely used network shares so they mount on first access, not during boot. Validate credentials to avoid long timeouts.
Always document changes and keep a rollback path. If a service is critical, consider masking only its “wait” companion or adding After= and Wants= adjustments via systemctl edit so dependencies don’t stall the boot.
Real-World Gains And Where To Learn More
In enterprise and developer setups, admins commonly report double-digit improvements after trimming a few high-impact units. Cutting a wait-online job and deferring container engines can reduce userspace time by 20–40% on SSD-equipped systems. Community case studies on Ubuntu and Fedora forums, as well as guidance from Red Hat engineers and the Freedesktop.org systemd documentation, echo the same pattern: measure first, then modify the smallest thing that moves the needle.
The bottom line is simple. If your Linux machine boots slowly, systemd-analyze tells you exactly why—fast. Use blame to spot hogs, critical-chain to understand the blockers, and plot to see the whole story. A few targeted changes later, you’ll likely be staring at a login prompt far sooner.