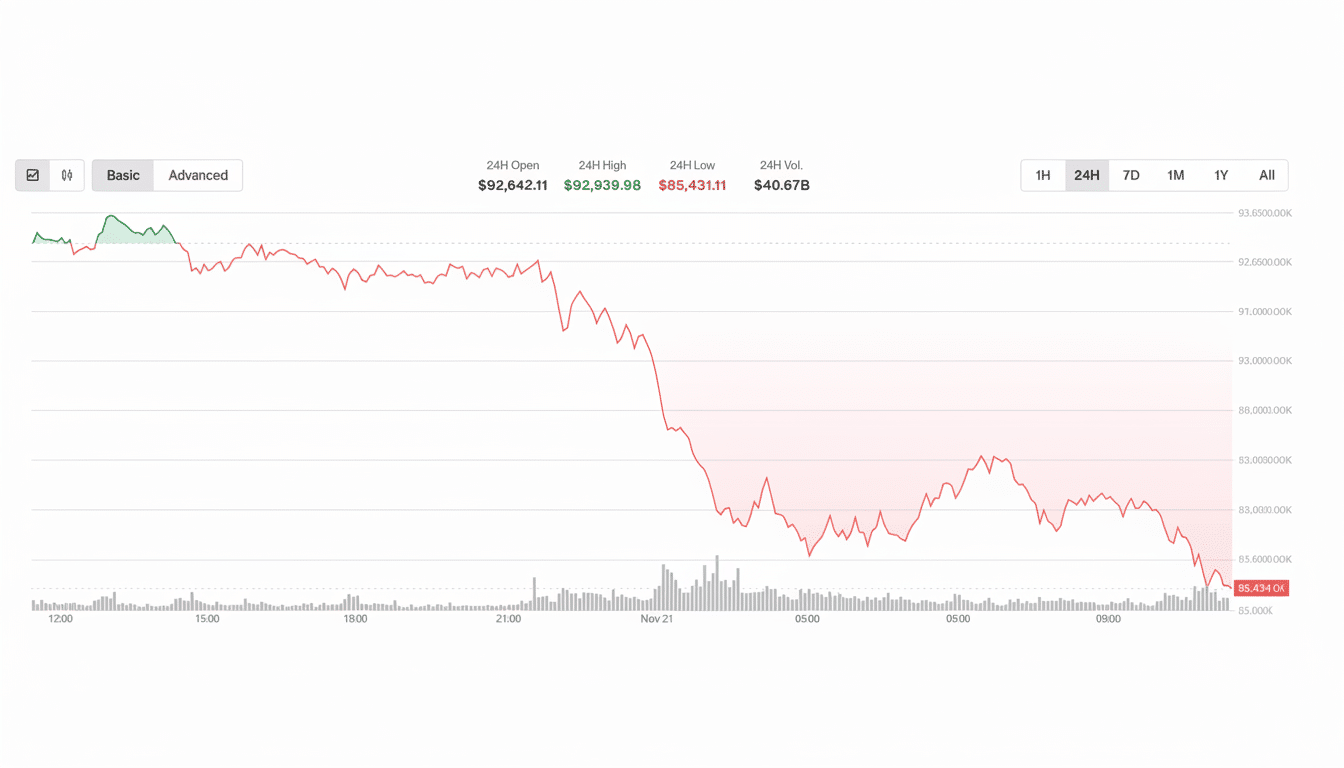
Bitcoin’s most recent tumble has brought it down to around $80,000, erasing weeks of gains and shaking up risk appetite across crypto. The new center of attention at trading desks is direct and uncomfortable: how low could selling pressure cause prices to go?
What’s driving the slide across crypto and risk assets
Macro crosswinds and thinning liquidity are magnifying every shift. Expectations for easier monetary policy have ricocheted, with a stronger dollar and higher real yields weighing on risk assets. Meanwhile, crypto’s internal plumbing has become procyclical: as price melts down, leverage unwinds, bids pull back, and volatility spikes.

On-chain signals scream that longer-term holders are passing the baton of distribution to over-leveraged traders during late-cycle strength—an early sign of panic selling against a backdrop of liquidation cascades and funding flips. Derivatives trackers have flagged billions of positions getting wiped in a matter of hours during the heaviest legs lower, all classic signs of stressed liquidity.
Sentiment is accordingly brittle. Bloomberg Intelligence’s Mike McGlone has cautioned that we could be seeing a setup similar to the 2018 pullback, claiming that if risk-off conditions get worse, Bitcoin ultimately will break down to $50,000. That view is not one-off: a few macro-minded desks see a regime shift if equities and credit teeter together.
Key technical levels and on-chain signals traders watch
Technicals are concentrated in the pocket that extends from the high-$70Ks to mid-$70Ks; recent spot demand, the 100-day trend metric on major venues, and option dealer gamma have offered support here.
A decisive, high-volume breakdown below that region would leave a gap to the $60,000–$65,000 area on previous consolidation and realized-value bands.
What is more, on-chain realized price for short-term holders sits just below spot, according to Glassnode, historically a pivot: hold it and bounces tend to stick; lose it and losses often multiply as weak hands capitulate. SOPR has now dipped below the breakeven line, meaning coins are increasingly being transferred at a loss—not an uncommon characteristic in early bear phases, with sellers beginning to become anxious.
Institutional positioning matters, too. Analysts quoted by Reuters point out the $80,000 level roughly coincides with the average spot Bitcoin ETF holder’s cost basis, and it is a psychological “line in the sand.” Standard Chartered has indicated that a drop below $90,000 would drive almost half of crypto-focused treasuries underwater and raise the likelihood for more de-risking.

ETF flows and whale activity shaping intraday liquidity
Someone’s got swings on the market. S&P 500: When spot Bitcoin ETFs start out, they really are magnets. Whenever creations slow, or net outflows materialize, authorized participants are required to redeem shares and sell underlying Bitcoin, adding mechanical supply. The pendulum has swung so far toward the ETF that CoinShares flow reports in recent weeks have reflected violent about-faces around key price breaks, illustrating how ETF tides now dictate intraday liquidity.
Whale wallets and miners add another layer. Aging coins waking up during rallies—a sign of distribution. From a Glassnode perspective, their data show that aging coins are coming back to life during this rally—a key point of distribution. Post-halving, miner margins are wafer-thin; Hashrate Index has reported increasing energy prices and balance-sheet pressure for some public miners—circumstances historically conducive to occasional selling of reserves into weakness.
How low could it go under varying market stress cases
Base case: If $75,000–$80,000 holds and ETF outflows stabilize, we might have a choppy range from here to $90K as dealers re-hedge and funding resets. That would be more consistent with a mid-cycle shakeout than a complete trend break.
Bear case: After shedding the mid-$70,000s with waning strength and liquidity, aim for a ride back down to the low-$60,000s. That zone encompasses realized-value clusters, a previous breakout retest, and a volume-weighted average price from the year’s first impulse rally.
- Tail risk — In a broader risk-off shock (equity drawdown, liquidity crunch, or policy surprise), capitulation could flare up through the $40,000–$50,000 zone.
(That band partly intersects with projections mentioned by Bloomberg Intelligence’s McGlone and scenarios described by market watchers such as Clem Chambers, who anticipates a crypto winter outlook if the mid-$80,000s go decisively.)
What could shift the narrative and stabilize the market tone
Three levers could stabilize the tape: a softer dollar and calmer rates backdrop, net inflows going through spot ETFs such as the largest U.S. products, and proof of miner and whale accumulation on-chain. Greater liquidity improvement—tighter spreads, shallower order-book gaps, lower forced liquidations—would go a long way to making rallies stick.
In the meantime, fatigue is setting in. Trend is turning over, risk budgets are being pared back, and the market’s chief buyers have gone tactical. Bitcoin has endured worse, but the near-term path of least resistance continues to be down unless—and until—policy, flows, or positioning flip significantly back in its favor.

